Object Explorer
The Objects page holds many tools for examining aggregated data on key objects in your Scene. Select the scene to display on the left side.
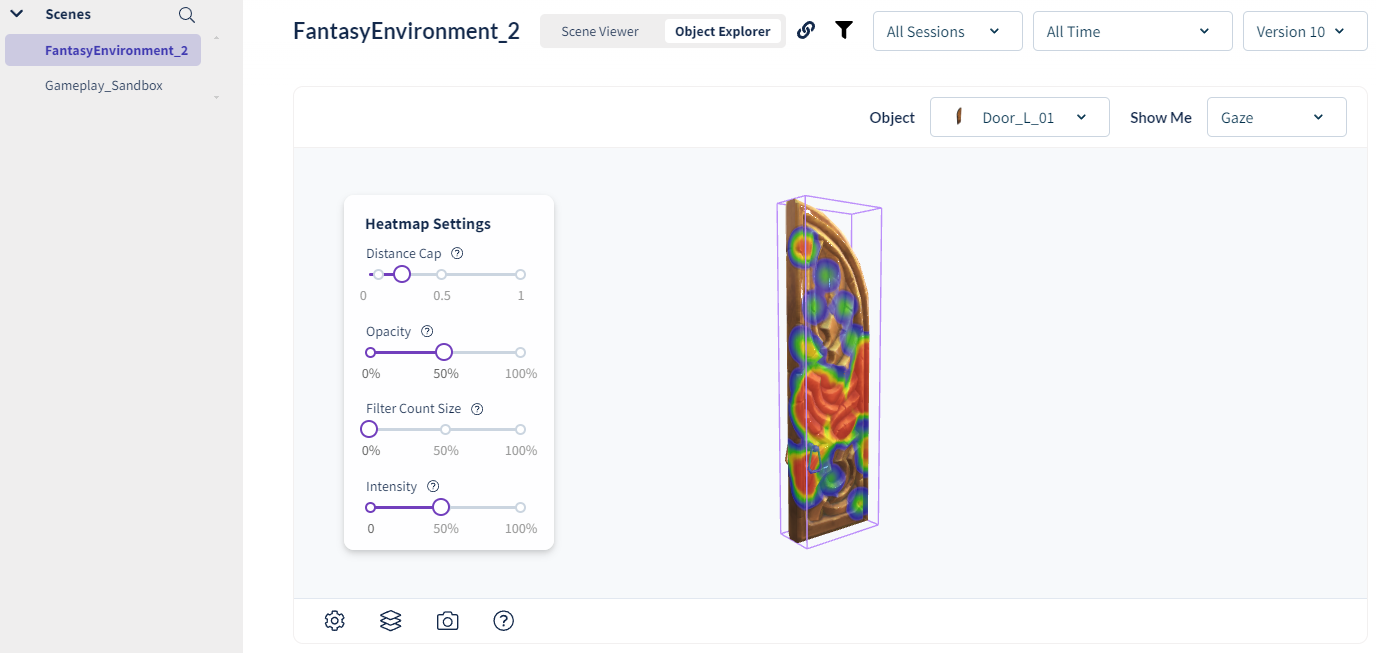
3D View
This shows a 3D representation of your Dynamic Object. Gaze data points are visualized as cubes or heatmaps. The colour represents density - the number of data points within an area.
The top right dropdown allows you to select different objects to view. Gaze data and eye Fixation data can be selected from the dropdown. The gallery view below can also be used to select which object to visualize.
There are several tools for this view:
-
Camera Controls. The camera will orbit around the object with the left mouse button, pan with the right button and zoom with the scroll wheel.
-
Settings Bounding Box. Enables a bounding box showing the extents of the object's mesh in purple. The extents of the gaze or fixation data are displayed in a green box.
-
Visualization. Several options for displaying data. Cube aggregation is often easier to see exactly where data points are in the scene. Heatmap will display data on the surfaces of the scene. There are heatmap settings to adjust the distance and falloff.
-
Take Screenshot. Takes a screenshot of the current view.
Gallery View
There are thumbnails for each Dynamic Object in the Scene and some high level metrics about the objects.
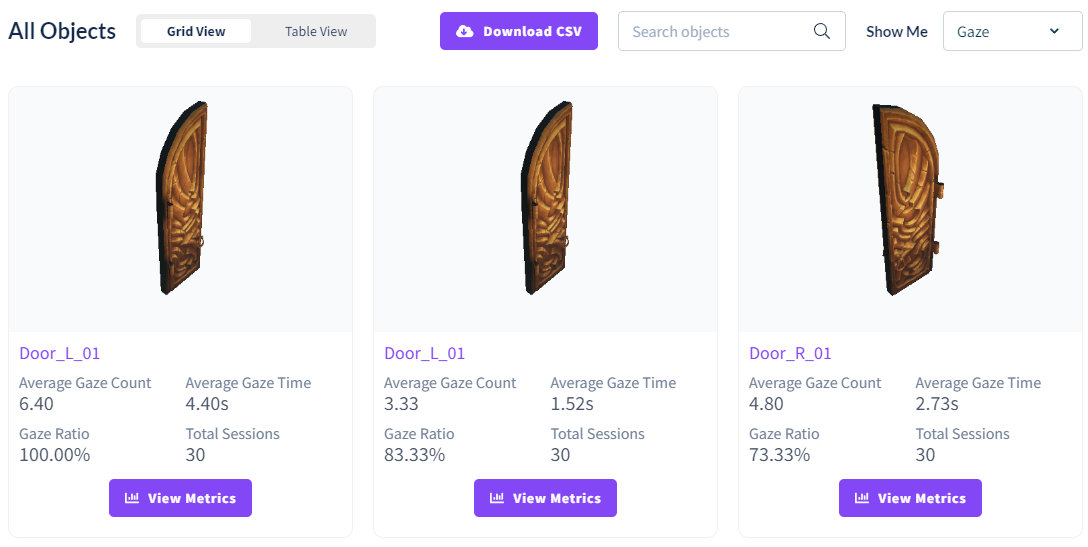
The Grid View/Table View buttons offer an alternate way of displaying this data.
The Download CSV Object Data allows you to download all aggregated data available for every Dynamic Object Instance in the Scene.
The View Metrics button under each Dynamic Object will open addition metrics and details about the object. See Object Details for more information.
![]() If you have a question or any feedback about our documentation please use the Intercom button in the lower right corner of any web page.
If you have a question or any feedback about our documentation please use the Intercom button in the lower right corner of any web page.