Spatial Optimizations
This page displays several metrics from the spatial data collected in your application. Filters are applied to all the widgets.
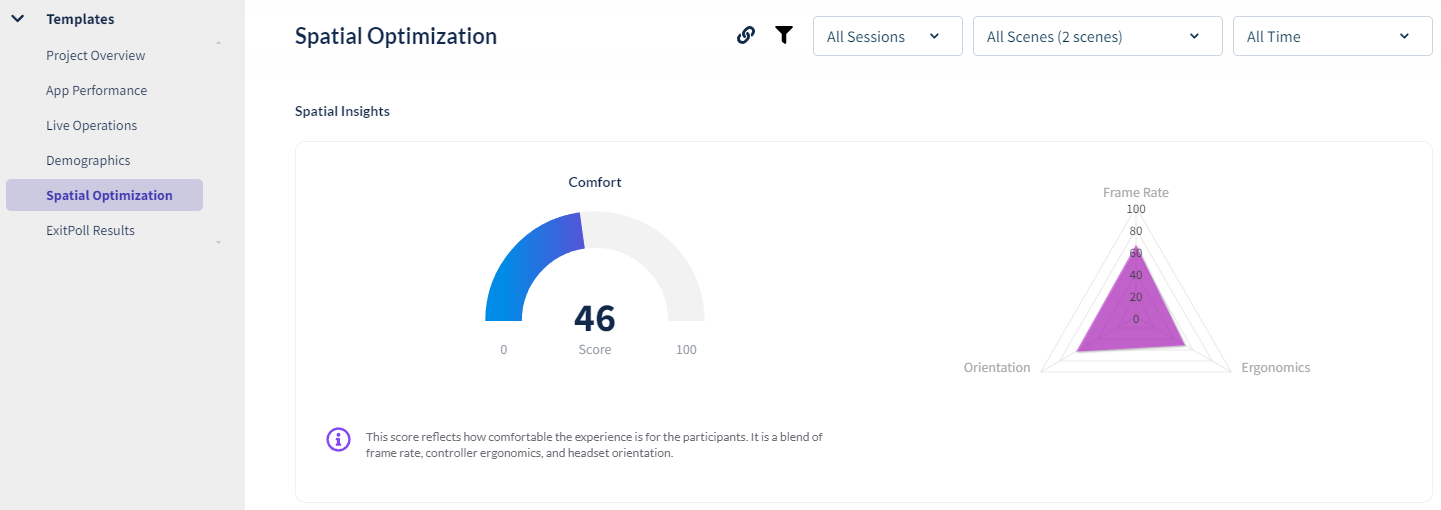
Comfort Score
A high level display of how comfortable a user is using your application. This is made by several metrics displayed in the graph to the right. Hover over the widget to learn more about the elements that contribute to this score.
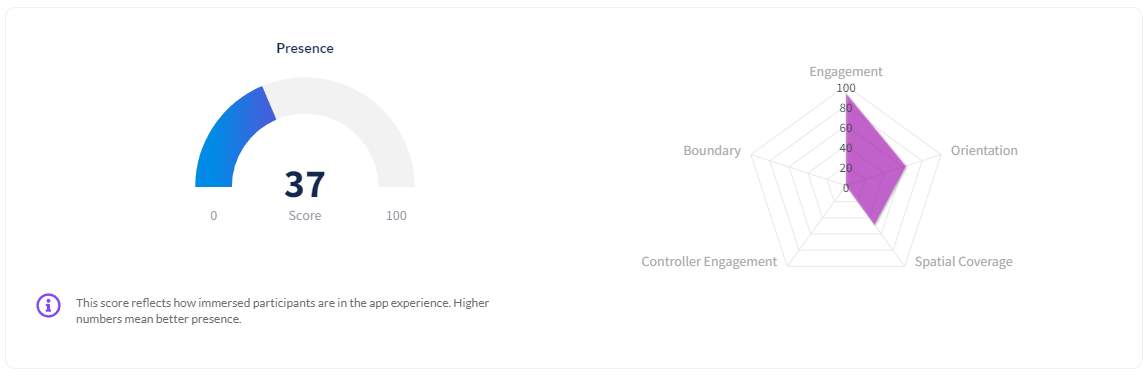
Presence Score
A high level display of how immersed a user is using your application. This is made by several metrics displayed in the graph to the right. Hover over the widget to learn more about the elements that contribute to this score.
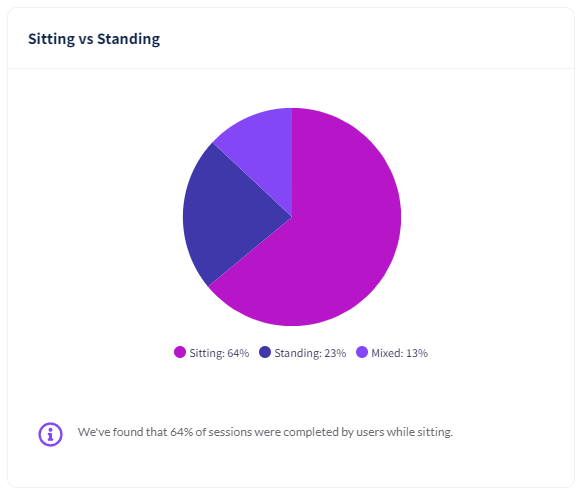
Sitting vs Standing
This displays the calculated method of user posture during a session. 'Mixed' indicates the data was inconclusive about the posture.
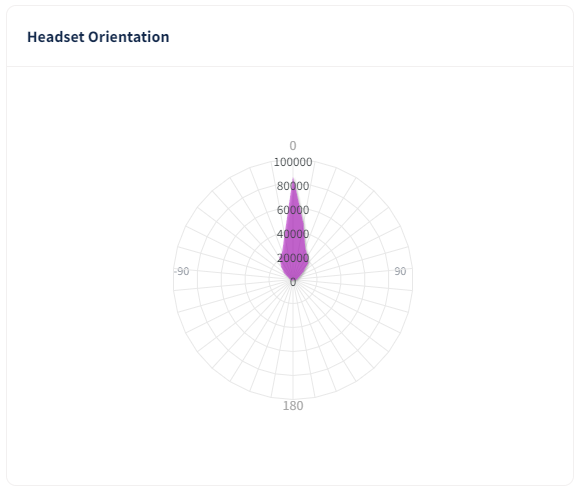
Headset Orientation in Real World Space
This displays the horizontal direction of the user's HMD in their real world space. This can be used to understand how a user moves around their real world room to explore virtual environments.
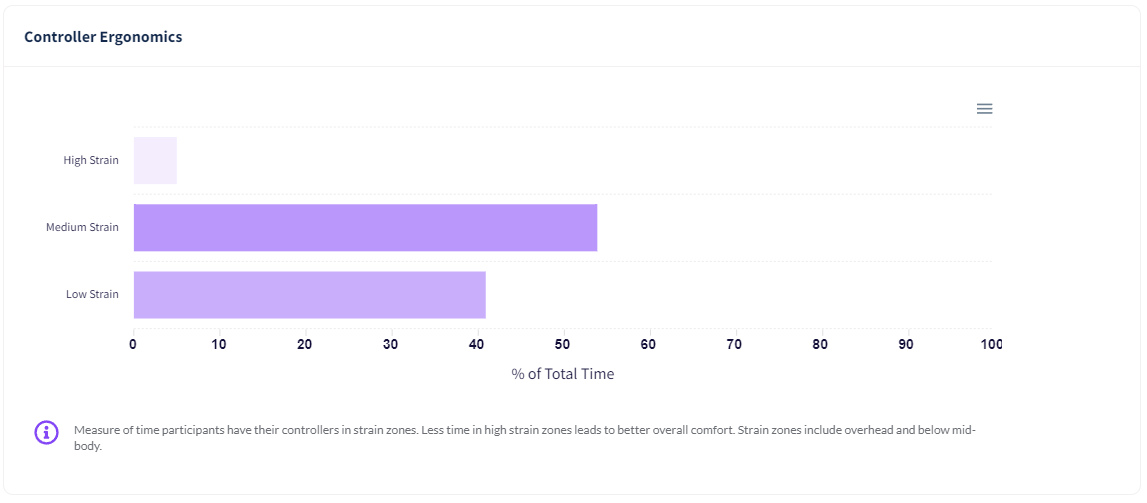
Controller Ergonomics
This is a calculated metric indicating the ergonomic strain on the user, caused by controller elevation.
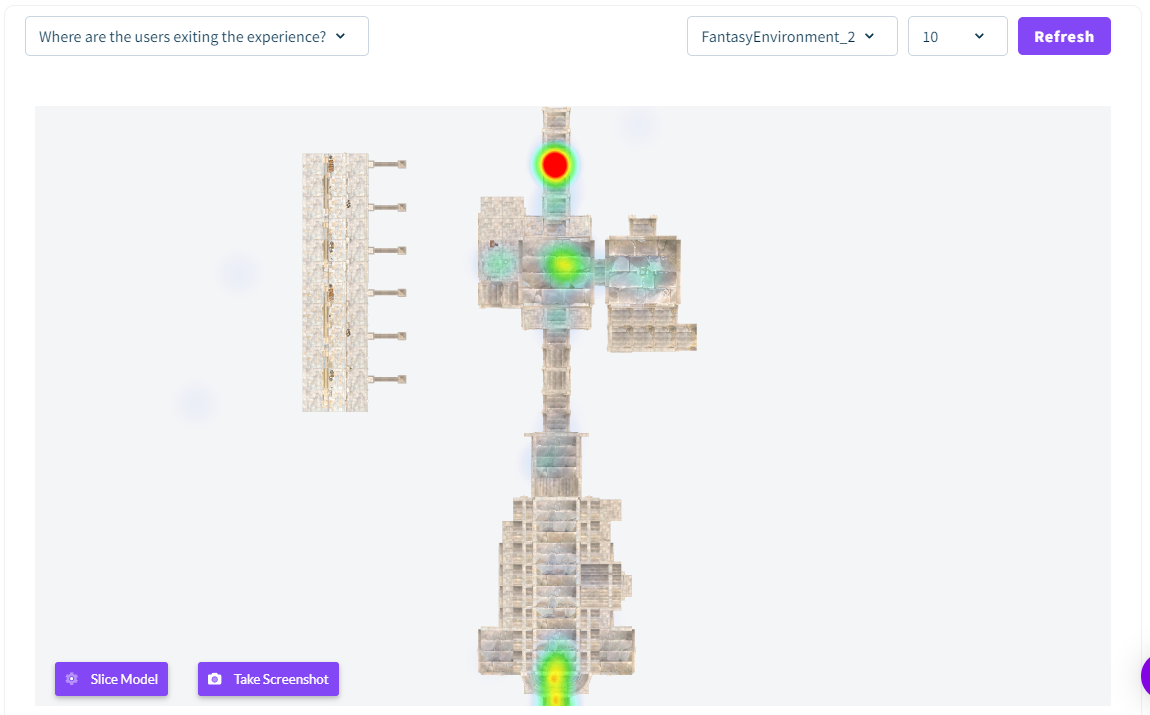
Experience Scene Viewer
This displays a top down map where the user experiences common events, such as exiting the application. Use the dropdown in the top left to select the event. Use the dropdown in the top right to select which scene to view.
![]() If you have a question or any feedback about our documentation please use the Intercom button in the lower right corner of any web page.
If you have a question or any feedback about our documentation please use the Intercom button in the lower right corner of any web page.