Analysis
This page gives you very powerful controls to query Event Data and Session Data. This tool is at the Project level, so your results can include data from different Scenes or Scene Versions.
Simple Mode
This mode provides dropdown menus to select Events (by name), Scenes (including versions) and a Date range. These options define the Query Scope. You can view this data in a Time Series or as a Total. You can also download these results as a CSV.
This Mode is very useful for some quick 'yes or no' questions.
Example Query - VR Training Adoption
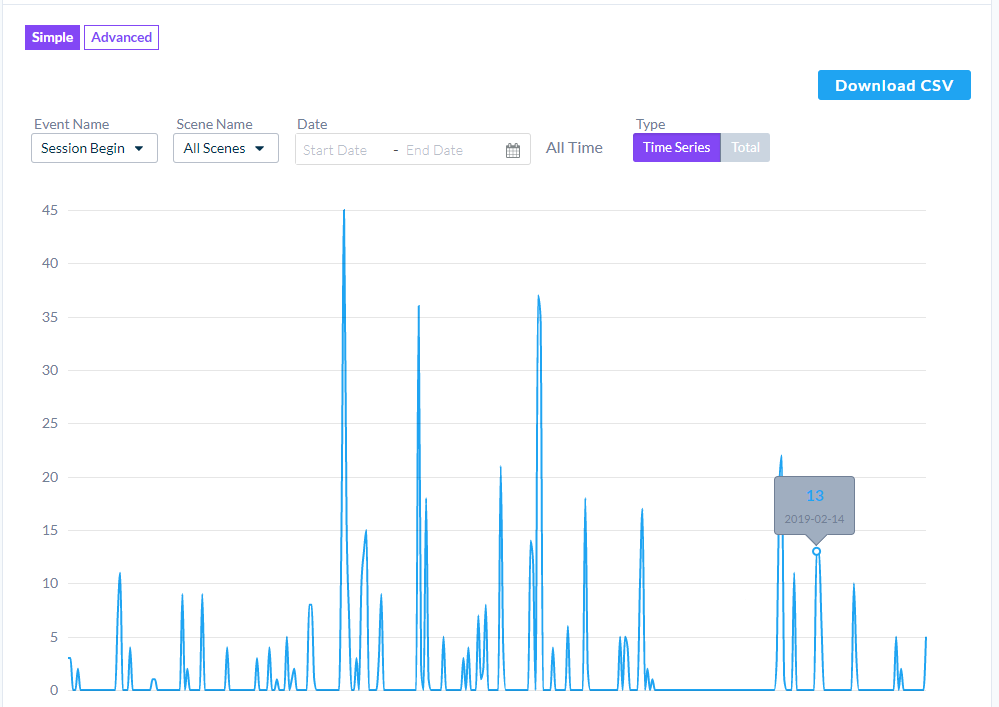
Let's say you are managing an immersive training experience across multiple branches of a company. To determine if the immersive training is being adopted by supervisors, you could search for the number of Sessions over time.
Are there more Sessions recently?
Example Query - Store Performance
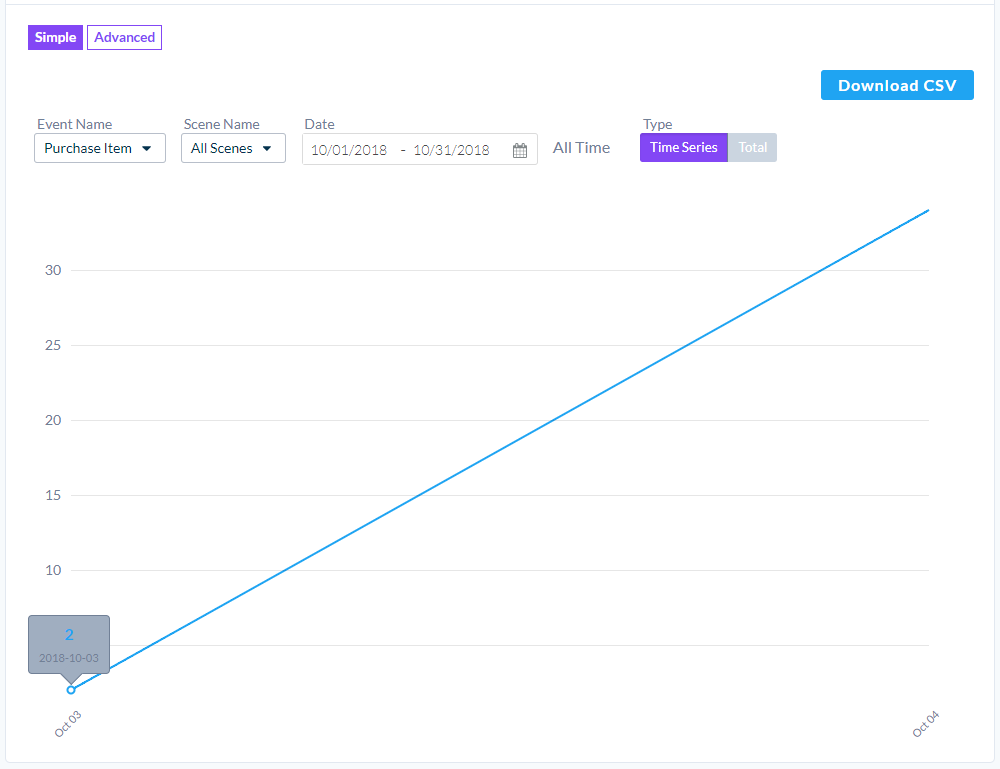
Let's say you are evaluating the performance of an immersive convenience store. You could search for the number of Purchase Events in September and compare this result to the number of Purchase Events in October.
Are the number of Purchase events up or down between these months?
If a Scene represents a variation of a store's layout, you could also filter by Scene. Are some stores layouts performing better than others?
Advanced Mode
Like the Simple Mode, there are options for the Query Scope to define what data will be queried - Events, Scenes and Dates. There is also a complex Data Filter to filter by Parameters, Group the results and change Operations to get different types of values from the Query.
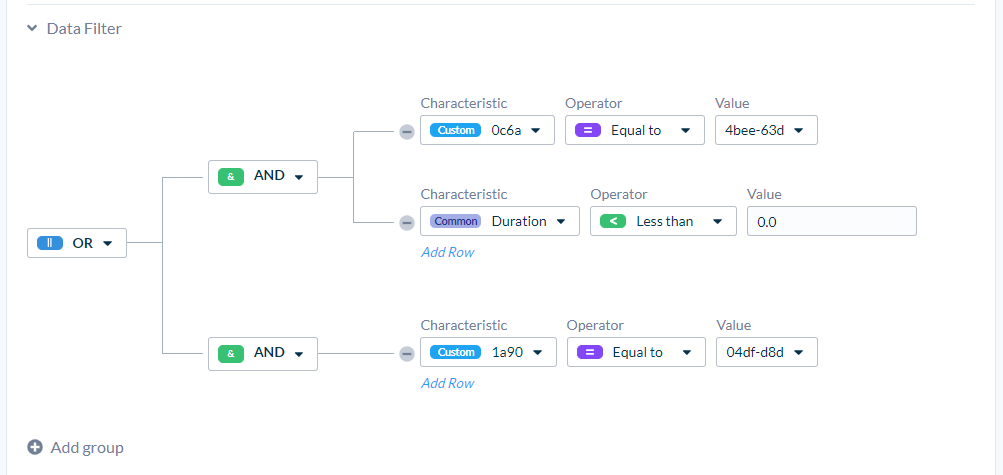
The Data Filter Section offers a branching collection of Filters to further refine your query. A Filter Parameter is made from a Characteristic, an Operator, and usually a Value. Characteristics are generated from Event Properties, Session Properties, and Common Meta Values. Operators allow for logical comparisons to Values. Select Add Row to create a new Filter Parameter.
These Filters are combined with Conditions. The valid options allow AND, OR, and NONE logical expressions. Press New Group to create a new Filter Condition with nested Filter Parameters. It will also create a Group Condition to describe the logical behaviour of how these Conditions combine.
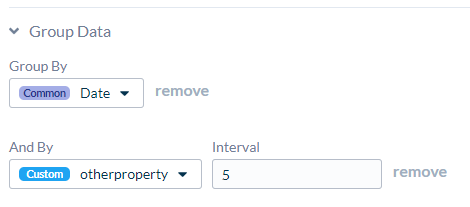
The Group Data Section allows you to group the query results together by a property. If the property is continuous (i.e., a float value) there will also be an Interval field so you can group this data by a range of values. The second Group field allows you to group the query results by date.
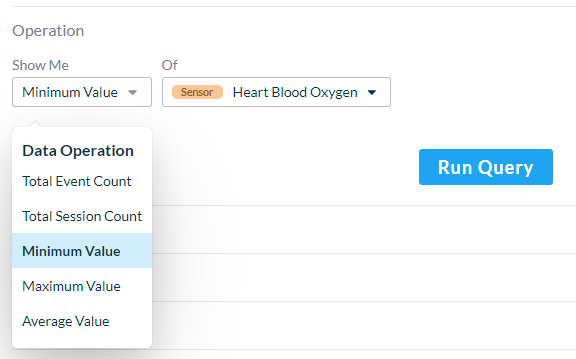
The Operation Section allows you to select the type of results you want from your Query. Minimum Value, Maximum Value, and Average Value Operations also display an additional field to select a property.
Run Query will process everything and return a graph to display the results. You can download the result data as a CSV.
Saving Queries
You can save queries and load them later. First, create your query, then click the "Save New" button at the top, and give it a name. You will then see a dropdown appear where you can switch between your saved queries. Queries are project-specific and will be visible to anyone with access to the project.
You can use saved queries for widgets on dashboards.

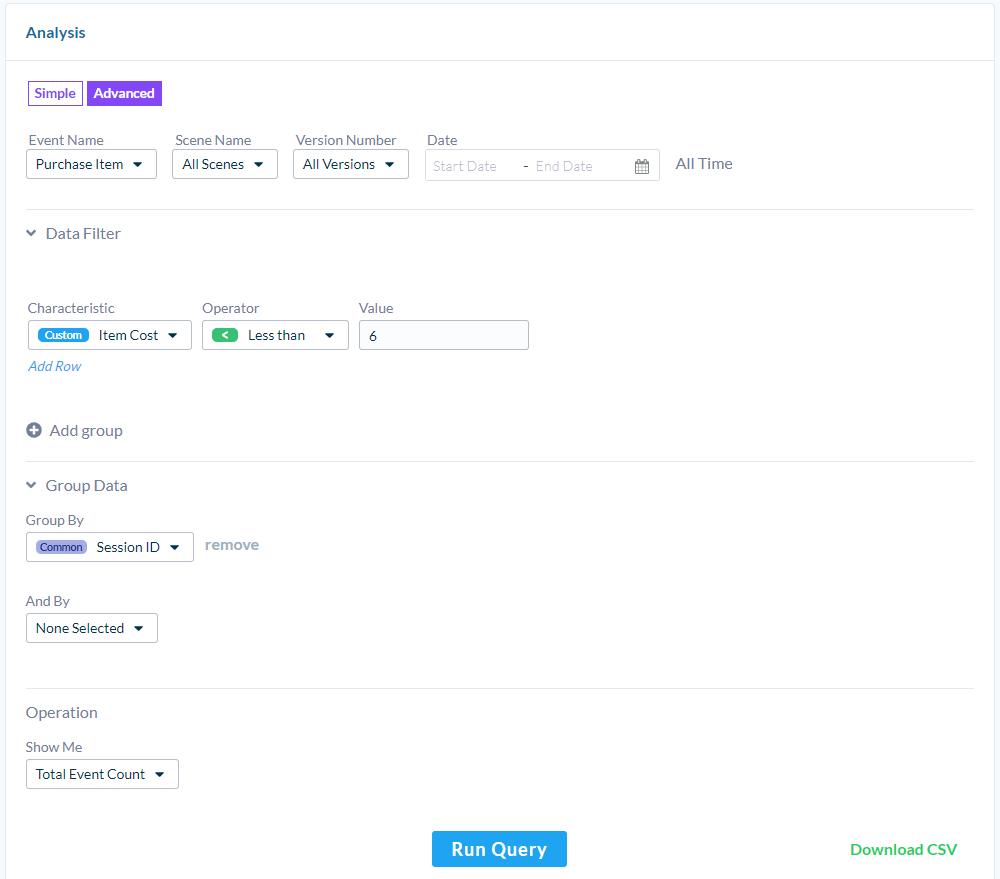
Example Query - Cheap Items
Let's say you have a immersive store and want to know the number of cheap Items Purchased. We can set the Query Scope to include Purchased Item Events and create a Filter Parameter based on the Item Cost property. Then Group the results by Session ID and Show Total Event Count.
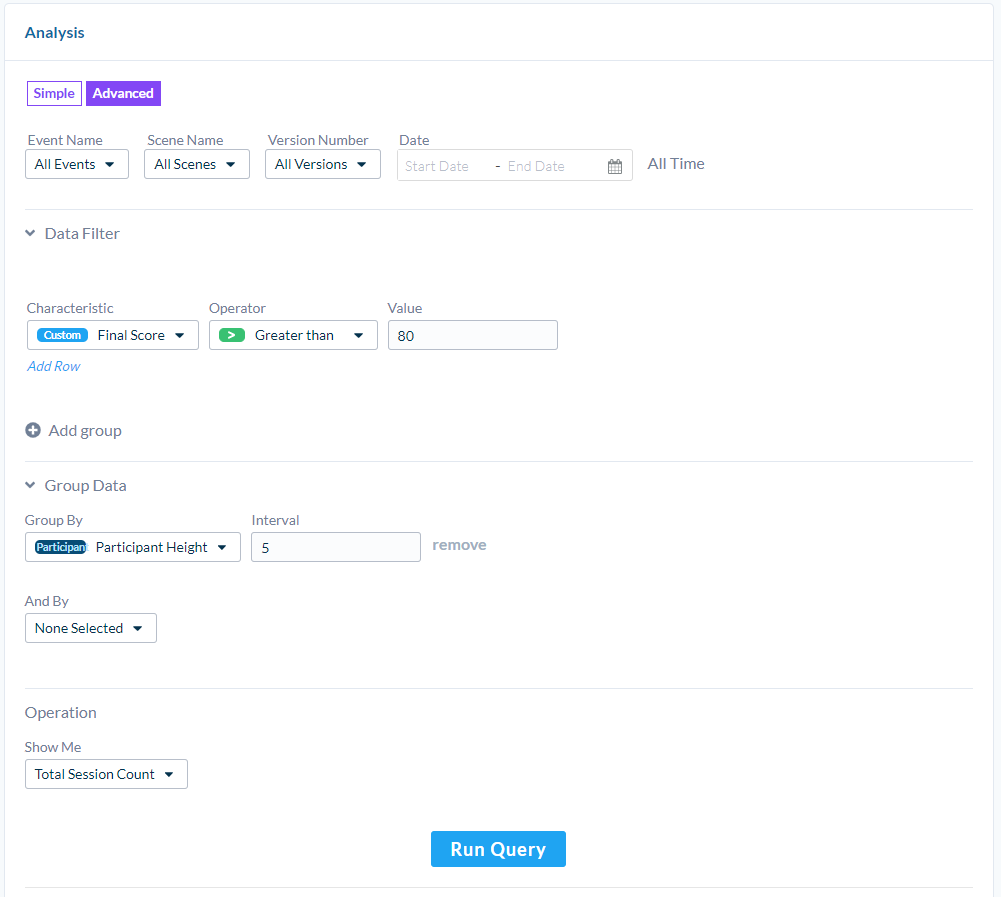
Example Query - Training by Height
Perhaps you're doing some training in VR that requires employees to fix an object overhead. You suspect taller employees will have an advantage. We can skip setting the Query Scope and set a Filter Parameter to include a Final Score Property above 80. Then Group the results by the Participant's height with an interval of 5 and set the Operation to show Session count.
Example Query - Experienced Training Heartrate
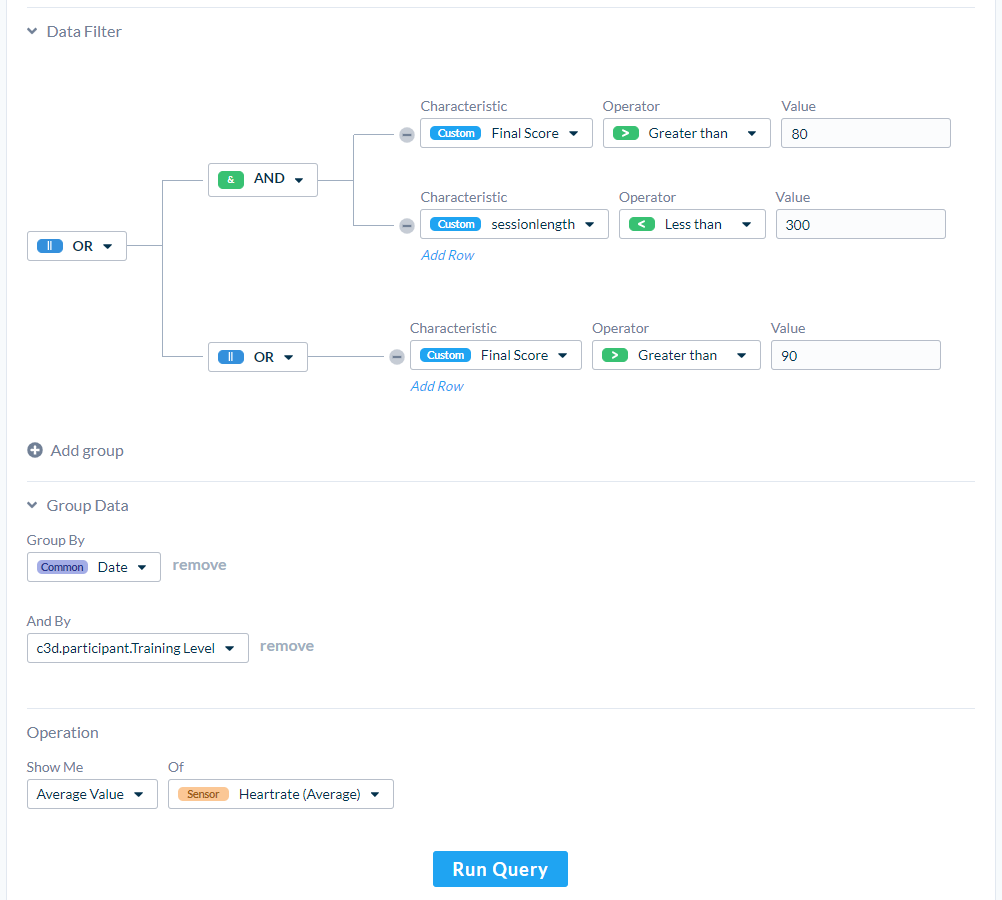
You suspect that experienced employees who efficiently complete some training in immersive experiences remain calm throughout. We can skip the Query Scope and set a Filter Parameter to include a Score Property above 80 and a Session Length property less than 300 seconds. In another Group, add another Filter Parameter with a Score Property above 90. This will return results that were either quite successful and fast or slower but exceptionally successful.
Then Group the results by a Property of the Participant's Training Level and by Date. Finally, use the Operation to show the Average Value of a Heartrate Sensor.