Scene Viewer
This page displays aggregated data from your Scene.
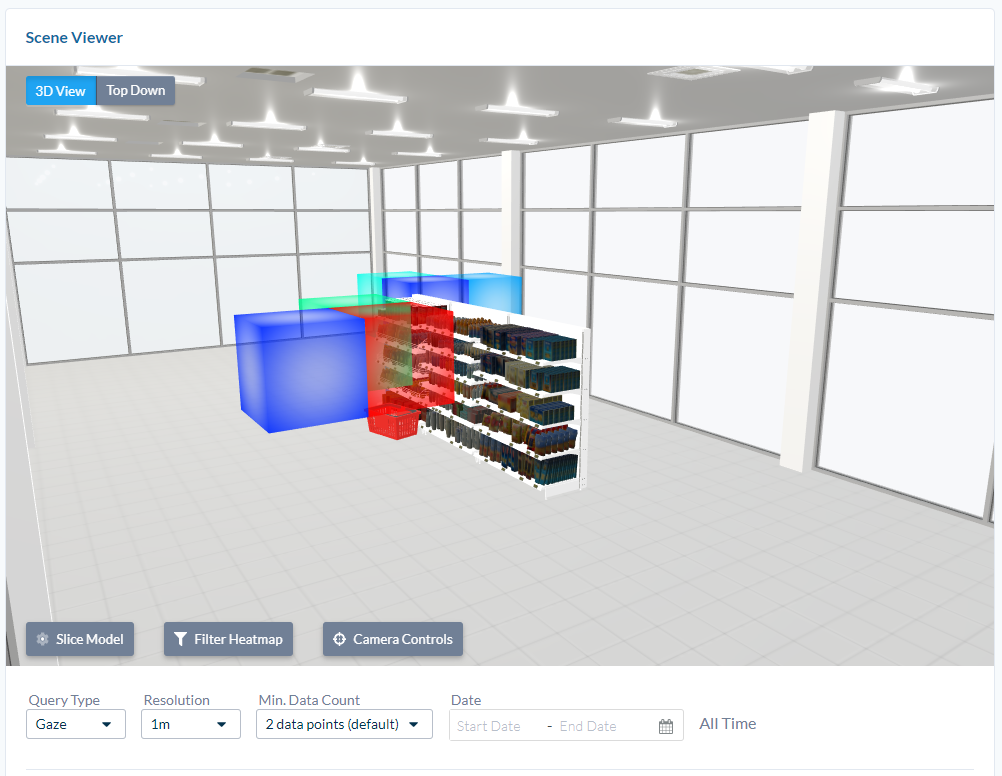
3D View
This shows a 3D representation of your Scene. Data is visualized as cubes. The colour represents density - the number of Data points within an area. There are 3 tools in the bottom left of this view:
-
Slice Model. Allows you to hide geometry and data points along the vertical axis. This is mostly used to hide geometry (such as a ceiling) so you can more easily view the data within the geometry.
-
Filter Heatmap. Displays the data values corresponding to the density of data points. You can also change the minimum and maximum ranges by dragging the number indicator.
-
Camera Controls. This gives you alternate controls for moving the camera in this view. Orbit Camera (default) will rotate the camera with the left mouse button, pan with the right button and zoom with the scroll wheel. First Person Camera will disable zoom and enable arrow (or WASD) controls to move the camera.
Top Down View
This view shows an orthographic camera looking at the Scene from above. Camera panning is controlled with the left mouse button and zooming is controlled with the mouse wheel.
A heatmap is generated from the current Query. This provides a quick overview of data point density with blue representing few data points and red representing many. Use the 3D view for more detailed insights.
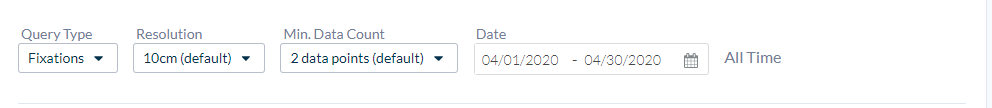
Query Display
These options are for selecting the type of data you want to visualize - Gaze, Position, Fixation or Events. The Resolution determines the range of positional data that are grouped together into cubes or heatmaps. Min Data Count provides a control to reduce outlier data points. The date control limits results to Sessions that fall within the specified range.
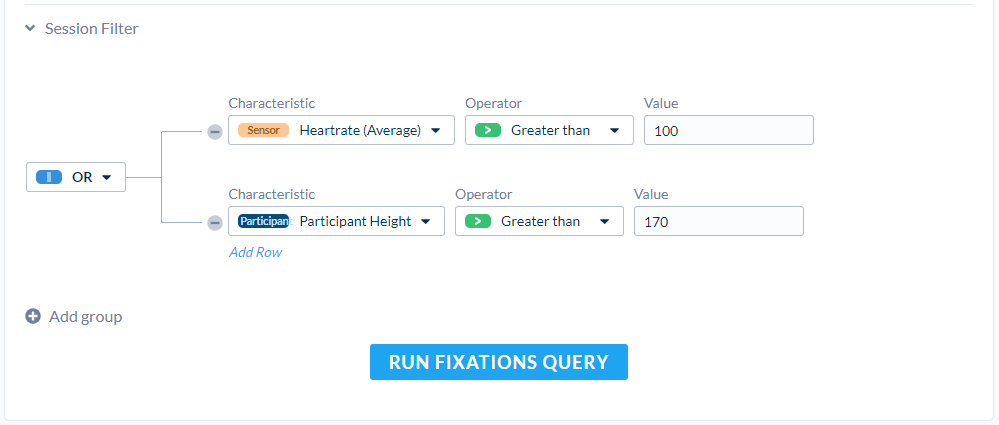
Session Filter
The Session Filter gives you powerful control to specify Sessions you want to visualize. Refer to the Analysis Tool for a more detailed look at how to organize a filter.
Example Use Case - Consumer Research
Let's say you have a focus group to purchase products in a immersive store. You can use Dynamic Objects to see how the Participants engage with the products. However, you also want to see how the Participants moved through the store.
- Record each Participant's Session
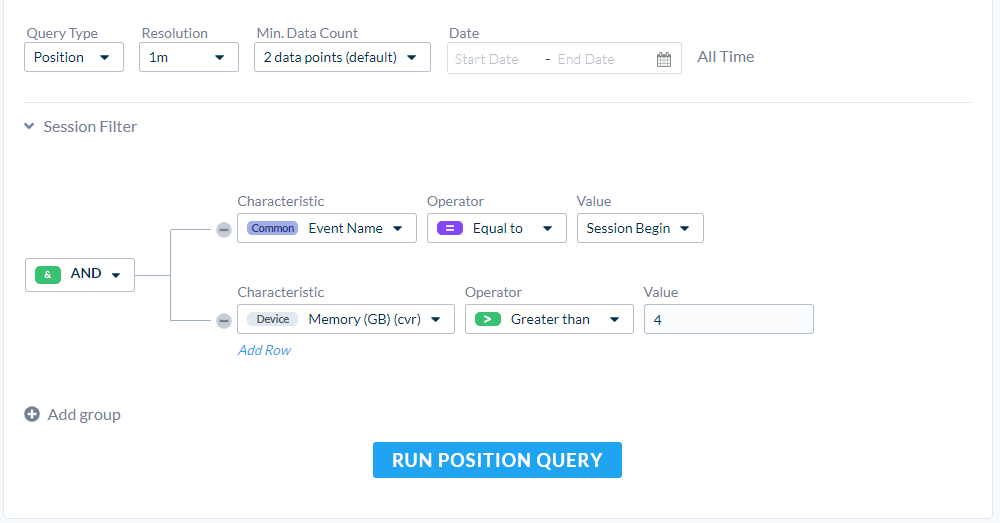
- Set the Scene Viewer Query Type to Position
Neat, but this information is not very specific to certain Participant's behaviours. Next, we can look at Sessions that purchased specific products.
- Add a new Filter with the Characteristic Event Name Equals Purchased Item
- Add a new Row to the filter and set the Characteristic as ProductName Equals Product A
- Set the Group as an AND comparison
Now we can start to see how different groups of Participants move through the store based on their purchasing habits. Maybe there's an opportunity to change advertising in the store? Maybe these Participants are skipping an aisle completely?
In the example above, some insights can only be gained when looking at 3D data in large aggregated samples. Be mindful that you aren't spending too much time looking at specific Participants when you really need to investigate general trends.
![]() If you have a question or any feedback about our documentation please use the Intercom button in the lower right corner of any web page.
If you have a question or any feedback about our documentation please use the Intercom button in the lower right corner of any web page.