Devices
The Devices page breaks down the hardware your participants are using and the geographic distribution of their sessions. Use it to understand which devices and locations are driving most of the activity in your XR program.
The project and year slicers in the right column apply to all visuals on the page.
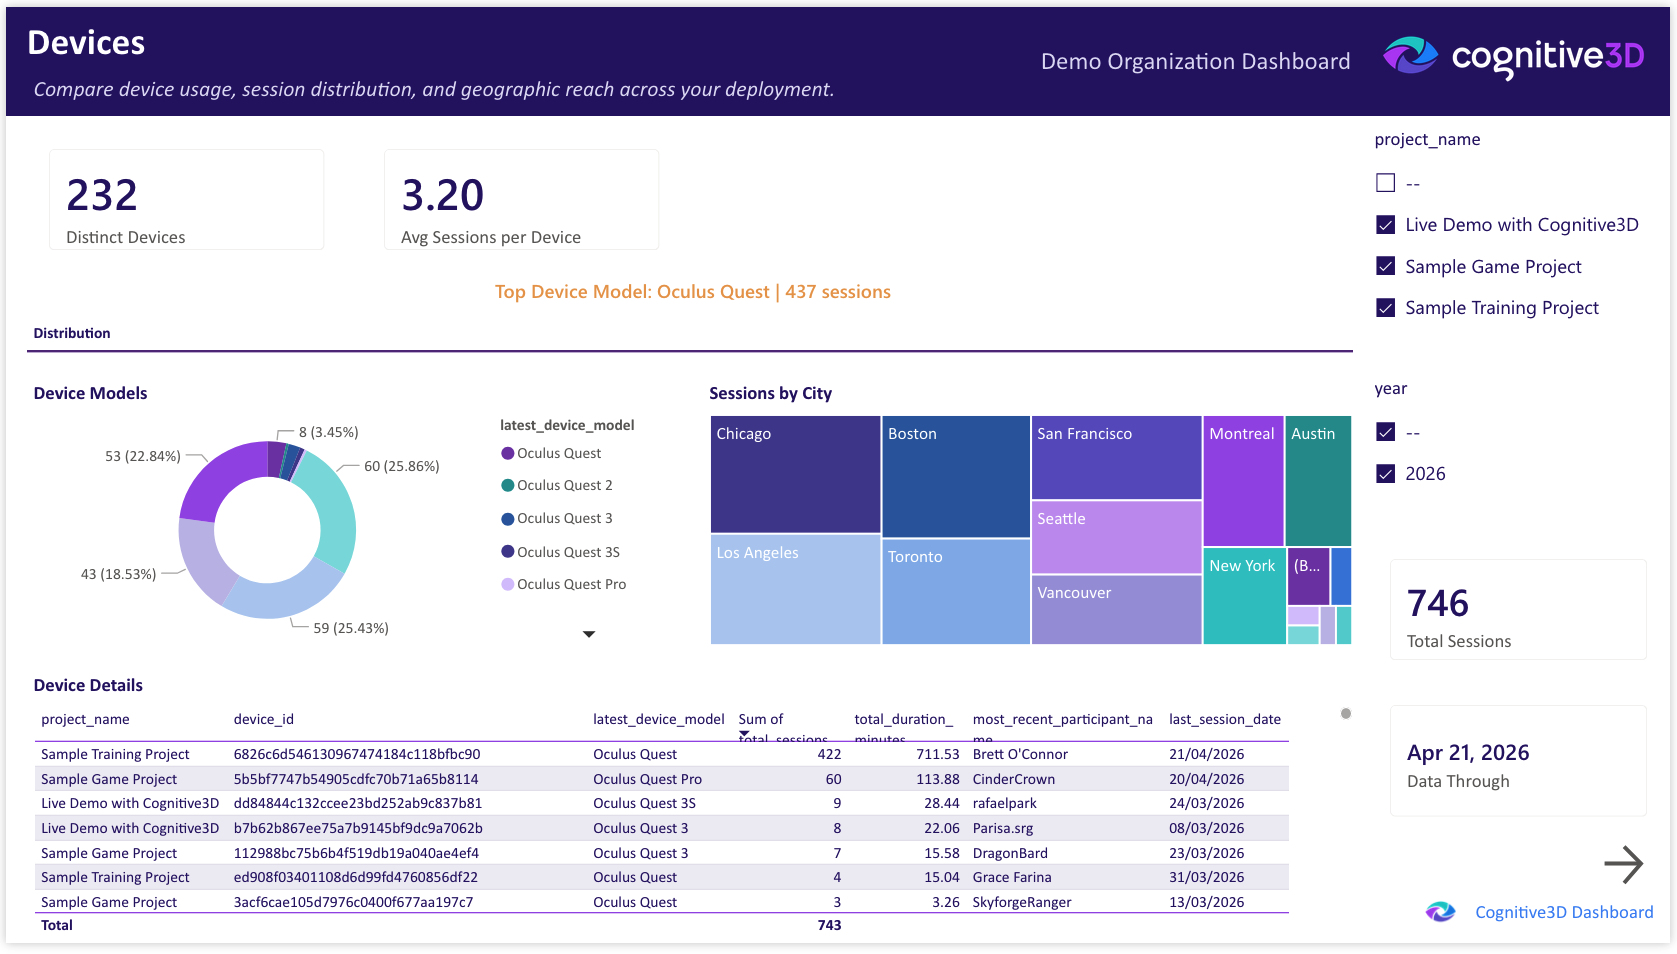
Total Sessions
The total number of sessions captured across the selected projects and time range.
Distinct Devices
The count of unique devices observed in the selected projects and time range. A device is identified by its device ID and is counted once regardless of how many sessions it records.
Avg Sessions per Device
The average number of sessions per device. Combined with distinct devices, this gives a sense of how shared each unit is across multiple participants.
Top Device Model
The device model with the highest session count in the selected time range. Useful for identifying the dominant hardware in your deployment.
Device Models
A donut chart breaking down session counts by device model. Surfaces the distribution of hardware across the selected projects.
Sessions by City
A treemap of session counts by city. Larger tiles indicate cities with higher session volume.
Device Details
A table of per-device detail including device model, manufacturer, total sessions, and total duration. Sortable by any column for quick top-N queries.
Data Through
The most recent session date represented in the dashboard. Reflects the last successful pipeline refresh from Cognitive3D.
![]() If you have a question or any feedback about our documentation please use the Intercom button (purple circle) in the lower right corner of any web page or join our Discord.
If you have a question or any feedback about our documentation please use the Intercom button (purple circle) in the lower right corner of any web page or join our Discord.