Objectives and Survey
The Objectives and Survey page tracks how participants progress through structured objectives within your experiences and how they respond to ExitPoll surveys. From this page you can drill through to a per-objective view showing step-by-step funnel analysis.
The project, year, and question slicers in the right column apply to all visuals on the page.
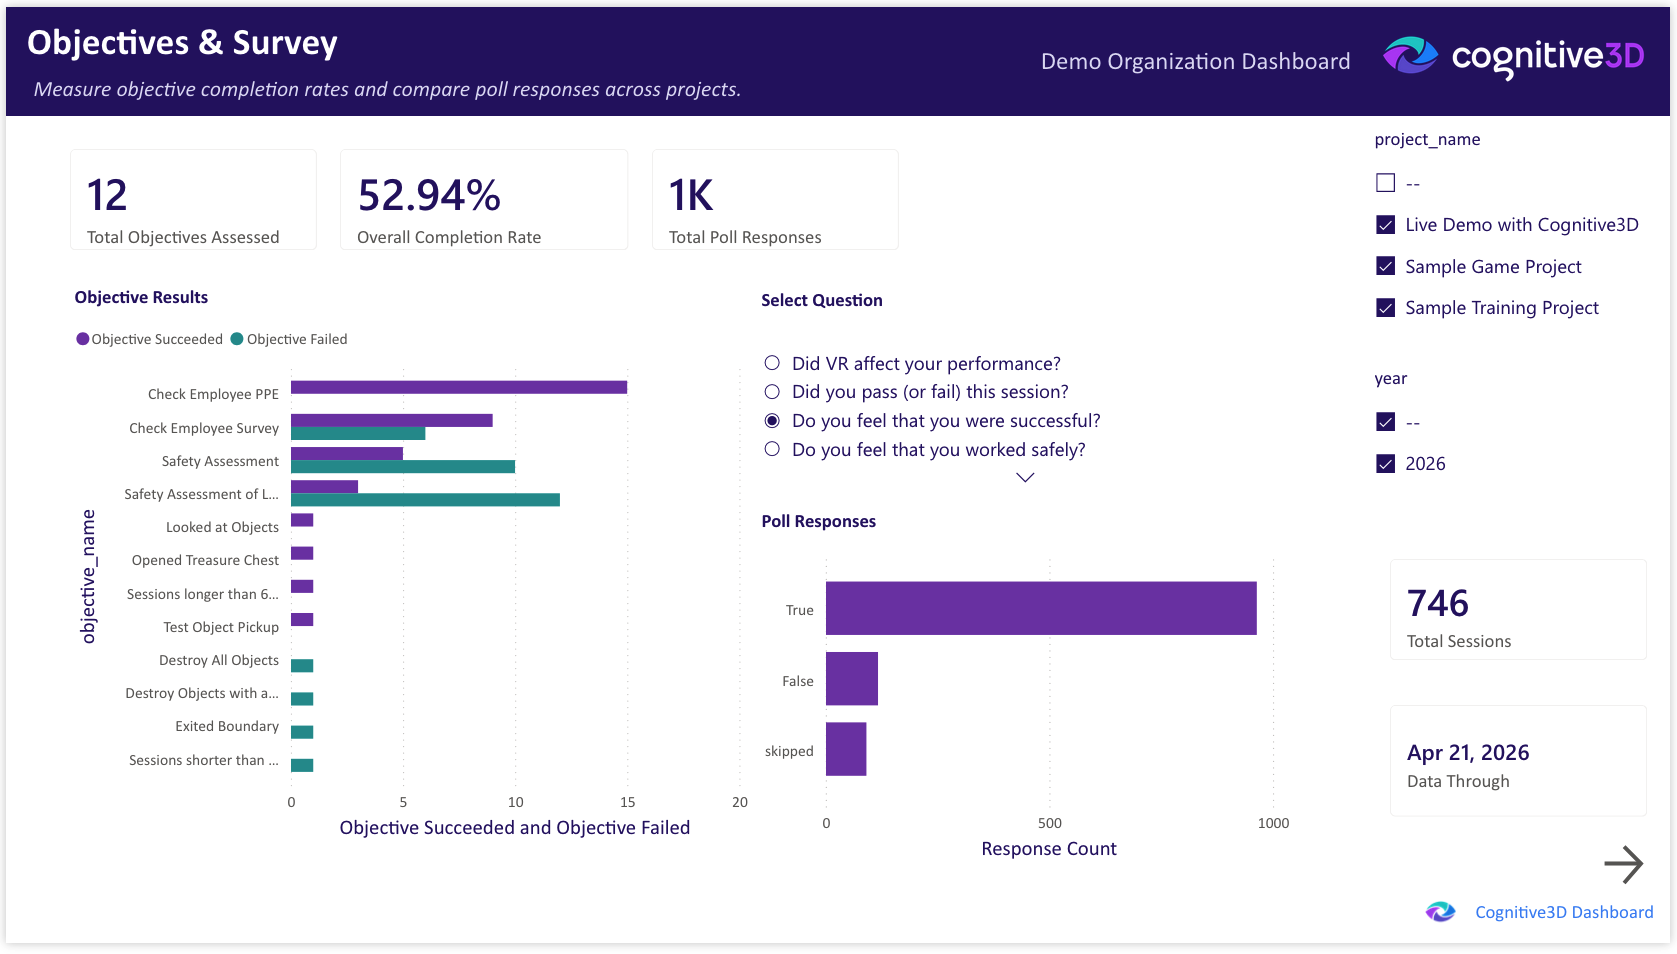
Total Sessions
The total number of sessions captured across the selected projects and time range.
Total Objectives Assessed
The total number of objective attempts evaluated across the selected projects and time range. An objective is assessed each time a participant has the opportunity to complete it within a session.
Overall Completion Rate
The proportion of objective attempts that ended in success, expressed as a percentage. A higher value indicates that more participants are reaching the success conditions defined in your projects.
Total Poll Responses
The total number of ExitPoll responses captured across the selected projects and time range.
Objective Results
A clustered bar chart breaking down objective outcomes — passes, failures, and incomplete attempts — per objective. Identifies which objectives participants are completing and which they are not reaching.
Poll Responses
A clustered bar chart of ExitPoll response distributions per question. Use the question slicer in the right column to focus on a specific poll question.
Data Through
The most recent session date represented in the dashboard. Reflects the last successful pipeline refresh from Cognitive3D.
Objective Detail (drillthrough)
The Objective Detail page is a drillthrough destination accessed by right-clicking any data point in the Objective Results chart and choosing Drill through, then Objective Detail. The drillthrough carries the selected objective and any active filters into the destination page.
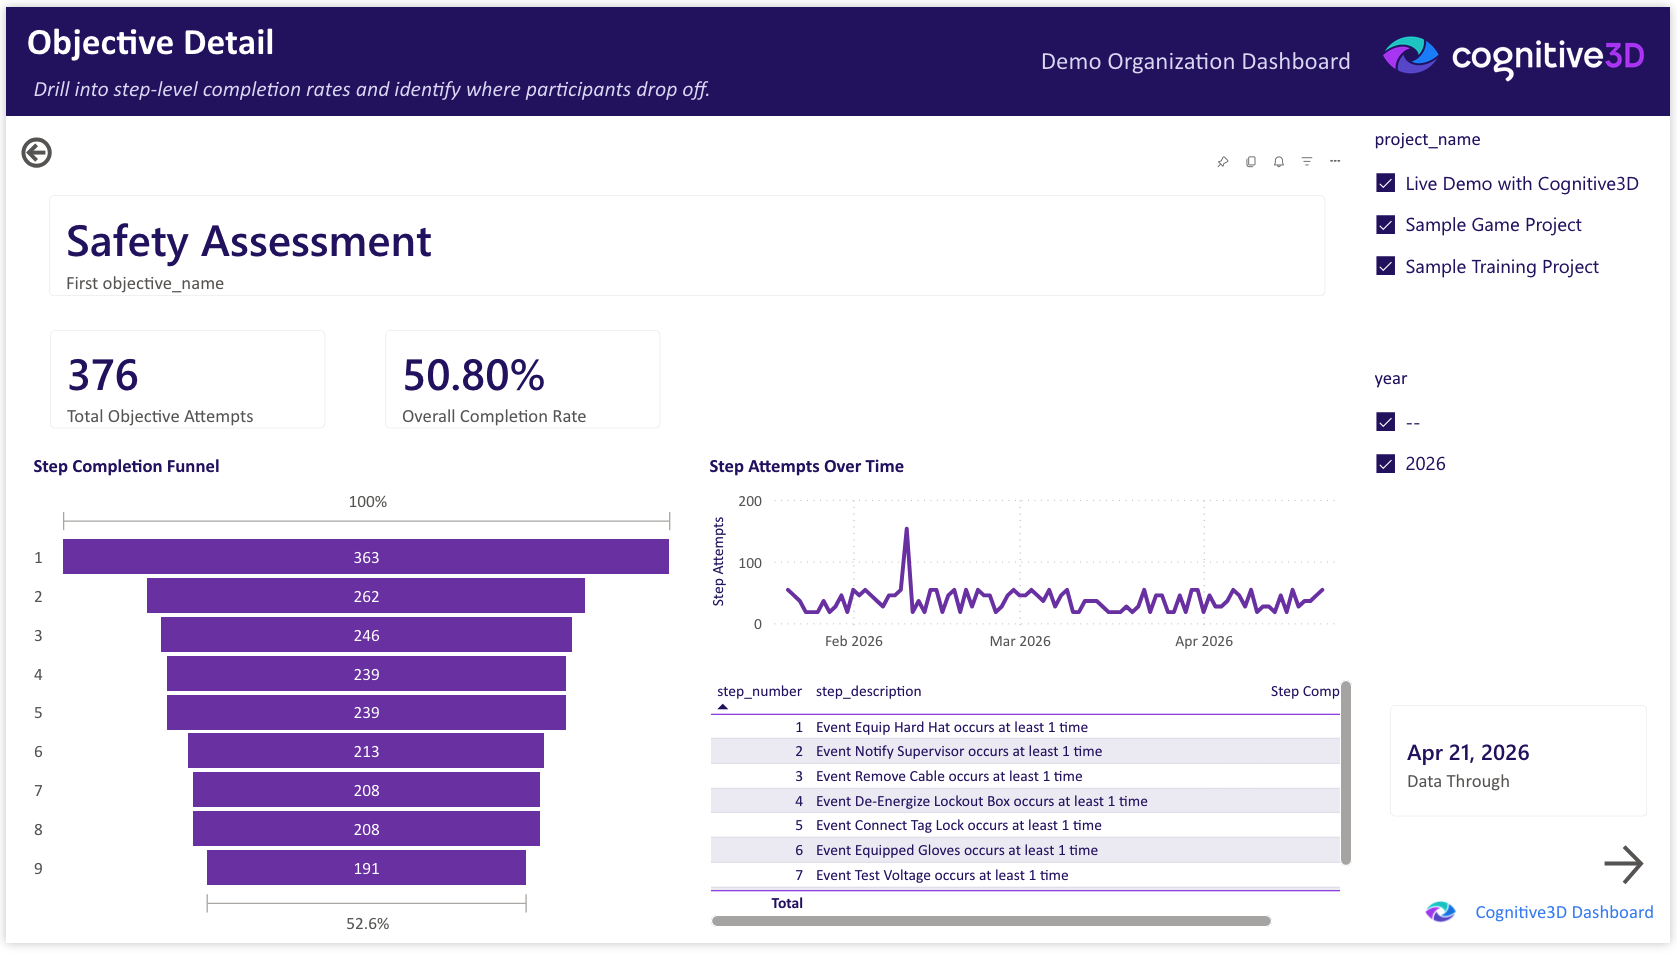
The drillthrough page surfaces step-level analysis for the selected objective.
- Total Objective Attempts — the total attempts at the selected objective.
- Overall Completion Rate — the proportion of attempts at this specific objective that ended in success.
- Step Completion Funnel — a funnel chart showing how many attempts reached each step in the objective. Surfaces the specific step where most participants are dropping off.
- Step Attempts Over Time — a line chart of step-level attempts over the selected date range. Tracks whether changes to the experience affect completion at a particular step.
- Step Details — a table of step-level statistics including attempt counts, completion rates, and average time spent at each step.
- Data Through — the most recent session date represented in the dashboard.
To return to the Objectives and Survey page, click the Back arrow in the top-left corner of the drillthrough page.
![]() If you have a question or any feedback about our documentation please use the Intercom button (purple circle) in the lower right corner of any web page or join our Discord.
If you have a question or any feedback about our documentation please use the Intercom button (purple circle) in the lower right corner of any web page or join our Discord.