Users
The Users page tracks participant engagement, retention, and activity patterns across your XR program. Use it to understand who is using your experiences, how often they return, and which projects are driving repeat engagement.
The project and year slicers in the right column apply to all visuals on the page.
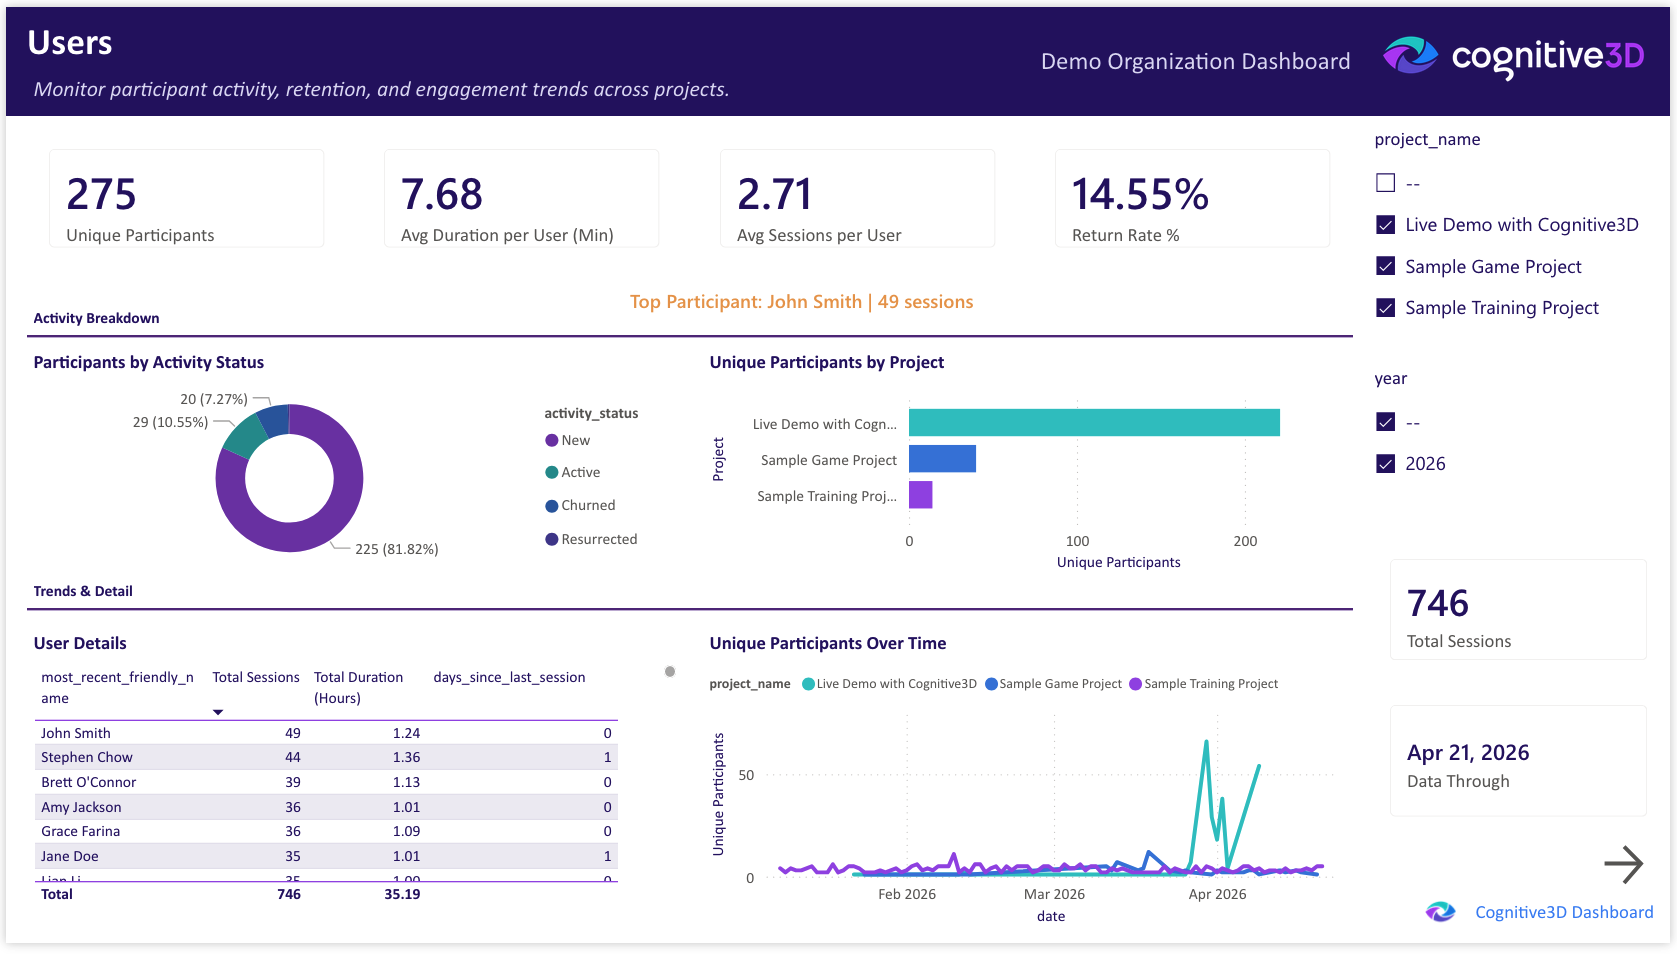
Total Sessions
The total number of sessions captured across the selected projects and time range.
Unique Participants
The count of distinct participants observed in the selected projects and time range. A participant is identified by Cognitive3D's participant ID and is counted once regardless of how many sessions they record.
Avg Sessions per User
The average number of sessions per participant in the selected time range. Higher values indicate that participants are returning multiple times rather than completing a single session and not coming back.
Avg Duration per User (Min)
The average total time per participant across all of their sessions, expressed in minutes. Combined with average sessions per user, this gives a sense of how deeply individuals engage with your experiences.
Return Rate %
The percentage of participants who recorded more than one session in the selected time range. Indicates how many participants return after their first exposure.
Top Participant
The participant with the highest session count in the selected time range. Useful for identifying the most frequent participants in pilot programs or evaluation cohorts.
Participants by Activity Status
A donut chart breaking participants into activity tiers based on session count. Surfaces the distribution between one-time, occasional, and frequent participants.
Unique Participants by Project
A bar chart of distinct participants per project. Useful for comparing reach across experiences in your portfolio.
Unique Participants Over Time
A line chart of distinct participants over the selected date range. Tracks audience size as cohorts join or drop off.
User Details
A table of per-participant detail including session count, total duration, and last seen date. Sortable by any column for quick top-N queries.
Data Through
The most recent session date represented in the dashboard. Reflects the last successful pipeline refresh from Cognitive3D.
![]() If you have a question or any feedback about our documentation please use the Intercom button (purple circle) in the lower right corner of any web page or join our Discord.
If you have a question or any feedback about our documentation please use the Intercom button (purple circle) in the lower right corner of any web page or join our Discord.