Performance and Health
The Performance and Health page surfaces frame rate stability, data completeness, and Cyberwellness Score across your projects. Use it to identify experiences with quality issues that may affect participant comfort or data reliability.
The project and year slicers in the right column apply to all visuals on the page.
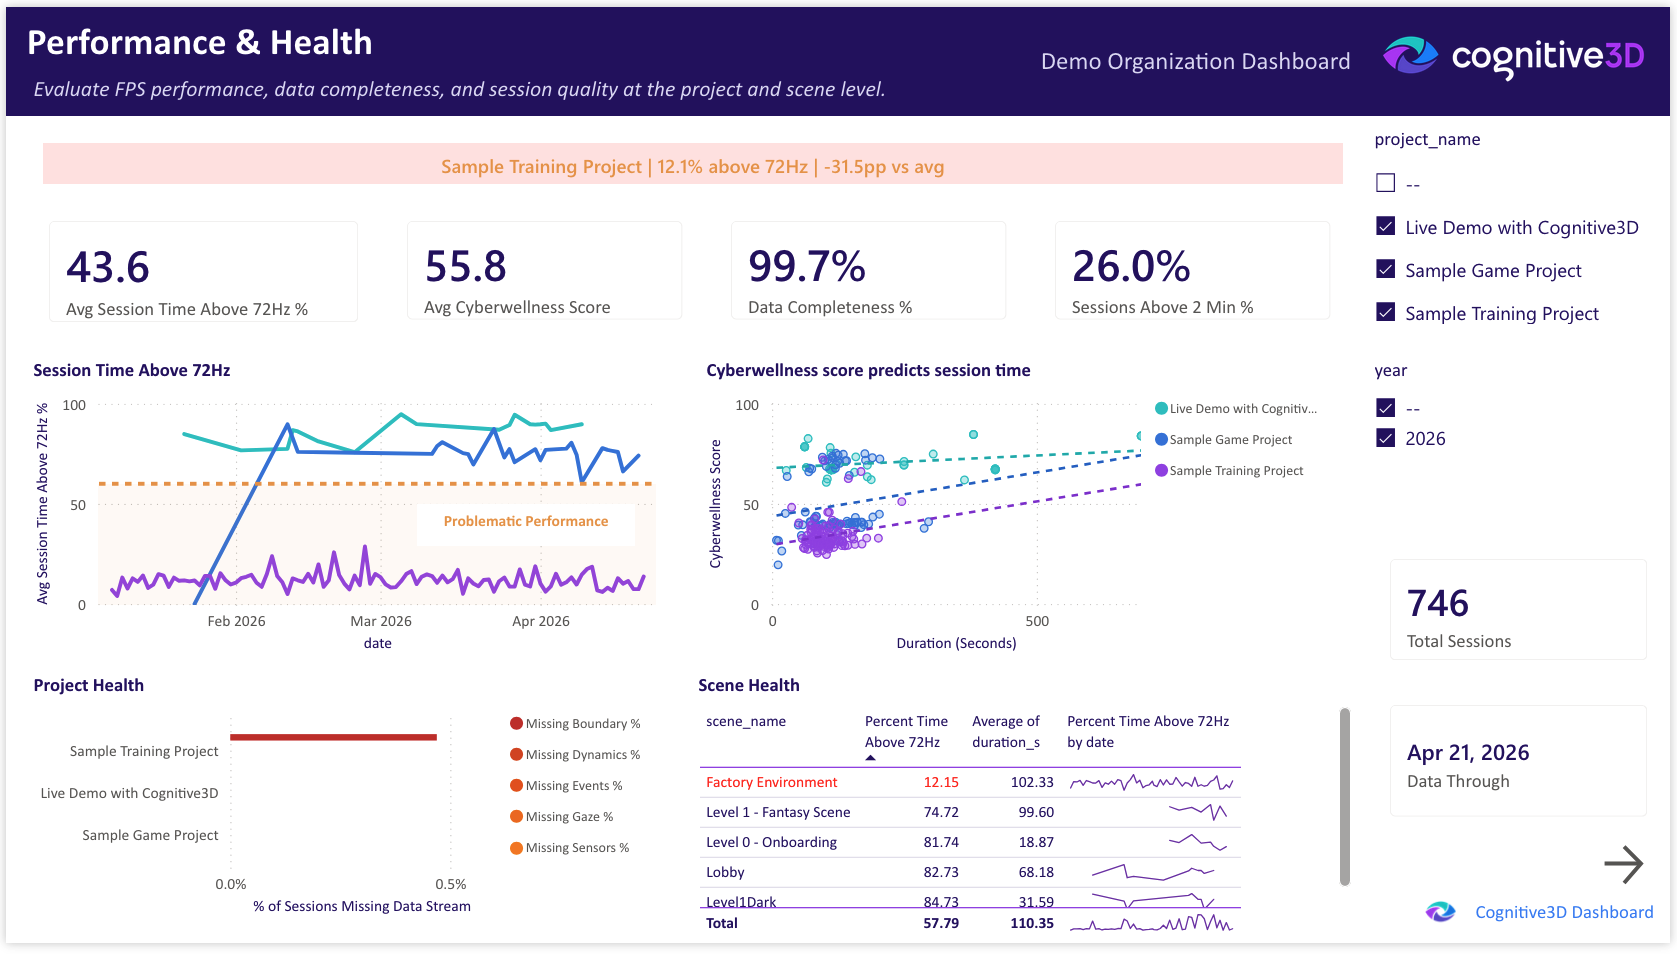
Total Sessions
The total number of sessions captured across the selected projects and time range. Provides context for the percentage-based health metrics on this page.
Avg Session Time Above 72Hz %
The average percentage of session time during which the application maintained at least 72Hz frame rate, across all sessions in the selected projects. See App Performance Standards for context on why 72Hz matters for VR.
Avg Cyberwellness Score
The average Cyberwellness Score across all sessions in the selected projects. See the Metrics glossary for the score definition.
Sessions Above 2 Min %
The percentage of sessions that exceeded 2 minutes in duration. Sessions shorter than this are often incomplete or accidental and may indicate launch issues or participant drop-off.
Data Completeness %
The percentage of sessions that include all expected data streams — gaze, events, dynamic objects, sensors, and boundary information. See the Metrics glossary for what each stream represents.
Worst Project Alert
A summary card highlighting the project with the lowest frame rate stability in the selected time range, including the gap between that project and the organizational average. Used as a quick signal for which experience needs the most attention.
Project Health
A clustered bar chart comparing performance metrics across projects. Per-measure colors use a deep red to amber gradient to draw attention to projects performing below the organizational average.
Session Time Above 72Hz
A line chart tracking the percentage of session time above 72Hz over the selected date range. Trends and inflection points indicate changes in performance over time.
Scene Health
A table of per-scene performance and quality metrics. Scenes with frame rate stability below 70% are highlighted in red across the entire row, including the scene name, to draw attention to problem areas.
Cyberwellness Score vs Session Time
A scatter chart correlating Cyberwellness Score with session duration. Patterns in this view can indicate whether longer sessions correlate with reduced participant comfort, or whether comfort is independent of duration.
Data Through
The most recent session date represented in the dashboard. Reflects the last successful pipeline refresh from Cognitive3D.
![]() If you have a question or any feedback about our documentation please use the Intercom button (purple circle) in the lower right corner of any web page or join our Discord.
If you have a question or any feedback about our documentation please use the Intercom button (purple circle) in the lower right corner of any web page or join our Discord.